Download our E-BOOK
Mobile App Metrics, Part 3: 2 Revenue Metrics
April 14, 2015
by Ashley Rondeau
This is part 3 of a 3-part series on mobile app metric best practices. Check out Part 1, Usage Metrics and Part 2, Acquisition Metrics.
>Here comes the money shot of our app metrics series. Literally. We’ll be diving into Revenue Metrics; the metric your CFO is most eager to track. Now that you know the usage patterns of your customer base, and how much it costs to acquire your customers, here are two key metrics to track to see just how much revenue you’re bringing in.>
1. Average Revenue Per User (ARPU)
This metric is simply the total revenue from your users divided by total users, in a given period of time. Depending on your business, it might make sense to calculate this using monthly numbers (good for subscription models) or all-time numbers (good for one-time purchase models).
Trending your ARPU is a quick and easy way for your company to see if there needs to be some course-correction. A dip in this metric means you need to quickly assess whether the amount of revenue coming in has decreased, or whether your user base has expanded without a corresponding increase in revenue. In general, if your ARPU is higher than your CAC (or CPI), you’re in good shape: you are making positive margin on each user.
So what is a good ARPU number? It varies by industry. Gaming seems to average about $1.96 and you can see that the top 1% games mop up the competition in this statistic. Meanwhile, a popular social app like WhatsApp has an ARPU of $7.00, which values it at astronomical levels. To get some comparison, here’s a chart with the ARPU of some big name companies in general:
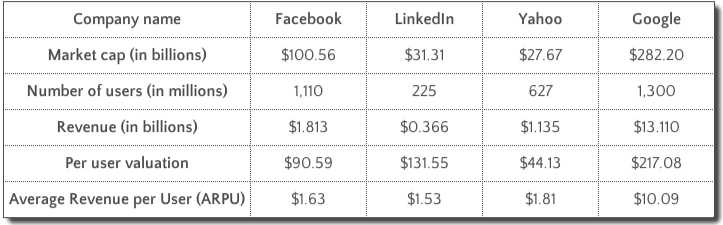
Source: Forbes.com
So if your app is making about a buck fifty from each user, congratulations! You’re the next LinkedIn…as long as you have the millions upon millions of users that LinkedIn also has.
2. Lifetime Value (LTV)
The other key revenue metric to track is the Lifetime Value of each user: how much revenue you expect to make from a customer as long as they remain a customer. The quick way to calculate this is ARPU divided by your churn rate, but LTV is a statistic that can get complicated very quickly. While you are sure to refine how you calculate LTV as you go, even a simple calculate of this metric will be incredibly helpful to trend.
In mobile, the “lifetime” of a user can usually be generalized to 1 year, though it varies widely as you can see in this chart from Flurry Analytics of the half-life (how long it takes to lose half their users) of apps in various categories:
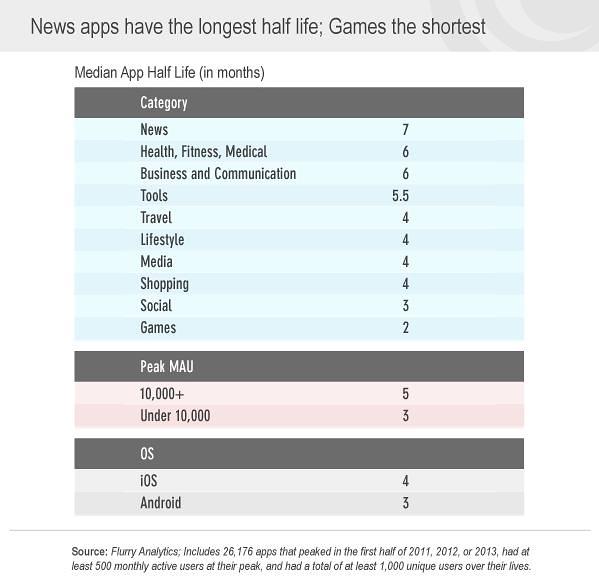
Thus, a year is a pretty generous time frame, but it generally ensures you’ll see all the revenue you will out of each user.
LTV is a metric you must always think about growing. How can you keep paying users longer? How can you get users to keep paying for your app or in your ecosystem? The top 1% grossing apps have an LTV 20 times bigger than the next top 5% grossing apps. This means that for your app to really win big, you need to keep thinking of ways to get more revenue from each user.
With ARPU and LTV, and all the previous metrics in our series, your burgeoning app company should be poised to use metrics to improve your business. Keep these metrics in plain view as you grow and stay on top of your numbers!
For more insights into the mobile app industry, follow our Twitter,Facebook, LinkedIn or RSS feeds.
Listview Photo Credit
Related Blog & Posts


How Long Does It Take to Build an App?
Explore the key factors influencing app development timelines in this insightful guide from Rocket Farm Studios.
Download E-Book
Ready to turn your app idea into a market leader? Partner with Rocket Farm Studios and start your journey from MVP to lasting impact.”
Related Blogs
Download Our Free E-Book
Whether you’re launching a new venture or scaling an established product, Rocket Farm Studios is here to turn your vision into reality. Let’s create something extraordinary together. Contact us to learn how we can help you achieve your goals.