This is part 2 of a 3-part series on mobile app metric best practices. Part 1 was Usage Metrics. Look for part 3, Revenue Metrics, in our next blog post.
From our previous post we examined how usage metrics are all about making sure your app is viable. Once you see that you indeed have a happy user base, the next step is to figure out how much it costs you to acquire a new customer. In the apposphere, where margins are fairly slim, keeping an eye on these acquisition metrics is key to your business staying in the black.
1. Customer Acquisition Cost (CAC)
No misdirection here, the Customer Acquisition Cost (CAC) is the fundamental metric to track. In theory, this is the sum cost of your marketing and sales efforts divided by the number of new customers over a given amount of time. However, for new app developers in smaller teams, the cost of development is usually factored in as well since it’s often difficult to separate out marketing costs and development costs (ie. if your app has a “share” feature built in).
Once you calculate CAC and have a baseline established, it’s the metric you want trending down as you expand your user base. One aspect that tends to be ignored is that different acquisition channels will have different CAC. A new user from your Google AdWords campaign will probably cost more than a new user from a popular blog post. It’s important to track the individual CACs of your acquisition channels to make sure one isn’t offsetting the other.
Measuring your CAC by channel is especially important now that acquisition costs are climbing higher and higher. In fact, BusinessInsider.com reports that costs per install on iOS increased 59% year over year, not to mention the cost of retaining users also increasing by 33%. So find the channel that is the most efficient for your company and give it your full attention. Remember, efficiency doesn’t always mean cheaper; it can also mean getting more new users faster as well.
A note on CPI: Cost per Install is a version of CAC specific to SaaS and mobile apps where the customer’s action (an install) is tracked instead of the customer. This term is common in mobile even though it amounts to basically the same concept.
2. Cost per Loyal User (CPLU)
This metric is growing in popularity in the mobile world. Generally, a loyal user is defined as a user that opens your app three or more times in the course of a given timeframe (usually up to a year). Because the rate of “one and done” users is high in mobile, CPLU can give a better idea of how much you need to spend to acquire a user that has a good chance of becoming a steady revenue stream. These loyal users, especially with apps relying on ads or in-app purchases, are the lifeblood of your business so it’s appropriate to give them special consideration in your metrics.
Fiksu’s CPLU index, among others, is an excellent resource that will show you the trend of CPLU. As you can see, the CPLU index has basically doubled in a year. Though this doesn’t break it down by app category, it’s good way to gauge whether your CPLU is generally in-line with the industry average.
3. Virality
Virality is not the easiest metric to calculate, but one that is growing more vital in mobile app analytics, specifically predictive analytics. Understanding the virality of your app can help you look into the future and extrapolate how many new installs you will see in the coming months. This can be extremely helpful in planning everything from necessary server space, to marketing and sales costs, to determining whether your app has a chance of success.
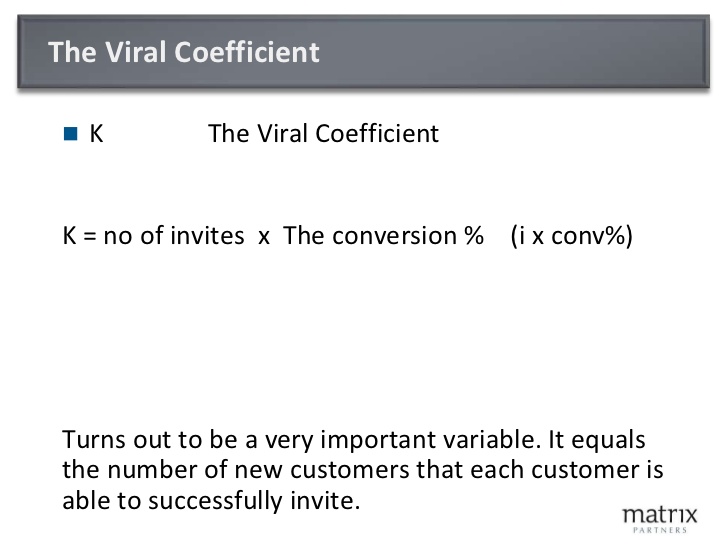
There are different methods of calculating virality. The one we think hits the idea the best comes from David Skok and his explanation of the Viral Coefficient (K):
Source: forentrepreneurs.com
If your K number is greater than 1, your product has viral growth. If not, you will want to focus efforts on either increasing the number of invitations sent out or the conversion rate of those invites. The Viral Time Cycle (the time it takes for someone to see your app and send it to someone else) also plays a part in virality, and a metric you want to keep as short as possible.
Think about virality this way: CAC is the primary metric of how much it costs to acquire a new customer, and virality (specifically the K factor) predicts how much additional spread you’ll get from your users, without any additional spend. If your virality trends up, you know that at the same level of cost you’ll be getting a much larger install base.
These three acquisition metrics are key ones to track for every mobile app company looking to use analytics to get more bang for the buck. Stay tuned for part 3 in our metric series where we will tackle the all important Revenue Metrics.


