Mobile App Metrics, Part 2: 3 Acquisition Metrics

March 31, 2015
 
Ashley Rondeau

This is part 2 of a 3-part series on mobile app metric best practices. Part 1 was Usage Metrics. Look for part 3, Revenue Metrics, in our next blog post.

From our previous post we examined how usage metrics are all about making sure your app is viable. Once you see that you indeed have a happy user base, the next step is to figure out how much it costs you to acquire a new customer. In the apposphere, where margins are fairly slim, keeping an eye on these acquisition metrics is key to your business staying in the black.

1. Customer Acquisition Cost (CAC)

No misdirection here, the Customer Acquisition Cost (CAC) is the fundamental metric to track. In theory, this is the sum cost of your marketing and sales efforts divided by the number of new customers over a given amount of time. However, for new app developers in smaller teams, the cost of development is usually factored in as well since it’s often difficult to separate out marketing costs and development costs (ie. if your app has a “share” feature built in).
Once you calculate CAC and have a baseline established, it’s the metric you want trending down as you expand your user base. One aspect that tends to be ignored is that different acquisition channels will have different CAC. A new user from your Google AdWords campaign will probably cost more than a new user from a popular blog post. It’s important to track the individual CACs of your acquisition channels to make sure one isn’t offsetting the other.
Measuring your CAC by channel is especially important now that acquisition costs are climbing higher and higher. In fact, BusinessInsider.com reports that costs per install on iOS increased 59% year over year, not to mention the cost of retaining users also increasing by 33%. So find the channel that is the most efficient for your company and give it your full attention. Remember, efficiency doesn’t always mean cheaper; it can also mean getting more new users faster as well.
apptimespentbyapprank
A note on CPI: Cost per Install is a version of CAC specific to SaaS and mobile apps where the customer’s action (an install) is tracked instead of the customer. This term is common in mobile even though it amounts to basically the same concept.

2. Cost per Loyal User (CPLU)

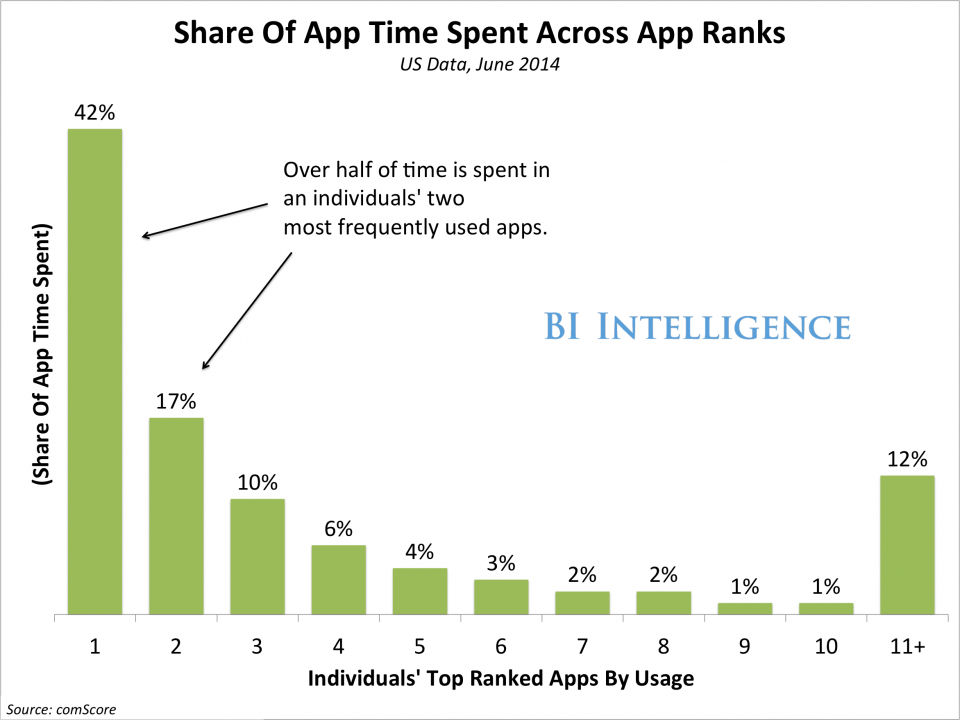
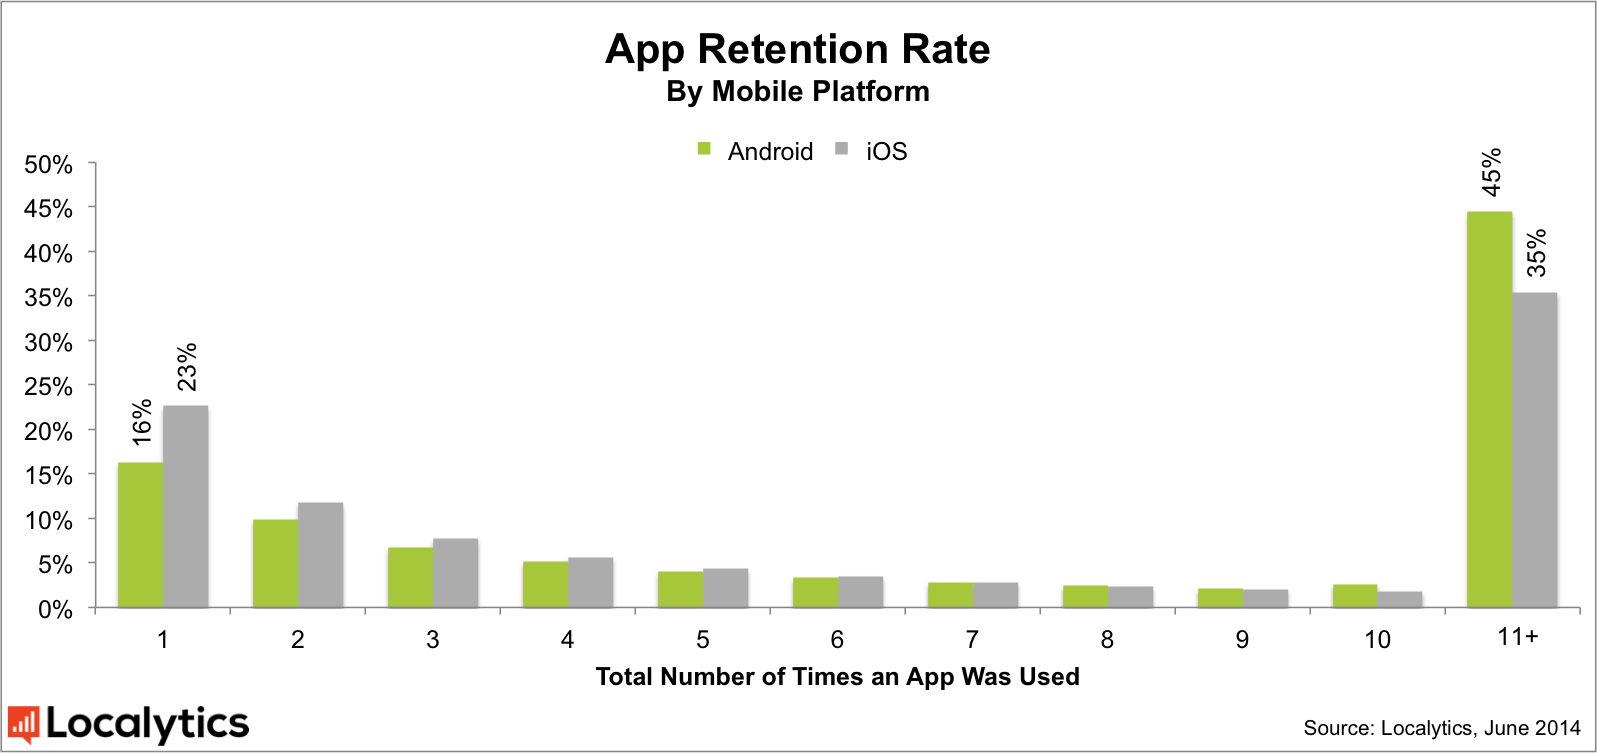
This metric is growing in popularity in the mobile world. Generally, a loyal user is defined as a user that opens your app three or more times in the course of a given timeframe (usually up to a year). Because the rate of “one and done” users is high in mobile, CPLU can give a better idea of how much you need to spend to acquire a user that has a good chance of becoming a steady revenue stream. These loyal users, especially with apps relying on ads or in-app purchases, are the lifeblood of your business so it’s appropriate to give them special consideration in your metrics.
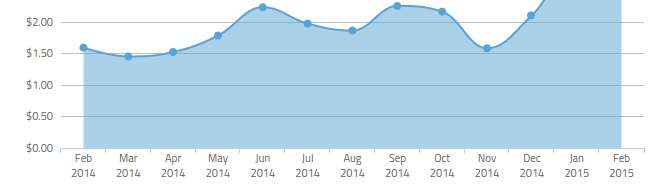
Fiksu’s CPLU index, among others, is an excellent resource that will show you the trend of CPLU. As you can see, the CPLU index has basically doubled in a year. Though this doesn’t break it down by app category, it’s good way to gauge whether your CPLU is generally in-line with the industry average.

3. Virality

Virality is not the easiest metric to calculate, but one that is growing more vital in mobile app analytics, specifically predictive analytics. Understanding the virality of your app can help you look into the future and extrapolate how many new installs you will see in the coming months. This can be extremely helpful in planning everything from necessary server space, to marketing and sales costs, to determining whether your app has a chance of success.
There are different methods of calculating virality. The one we think hits the idea the best comes from David Skok and his explanation of the Viral Coefficient (K):
 the-science-behind-viral-marketing-9-728
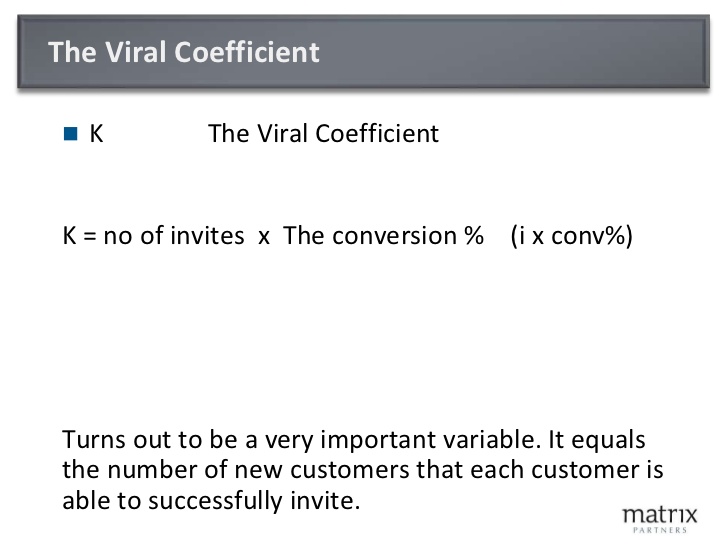
Source: forentrepreneurs.com

If your K number is greater than 1, your product has viral growth. If not, you will want to focus efforts on either increasing the number of invitations sent out or the conversion rate of those invites. The Viral Time Cycle (the time it takes for someone to see your app and send it to someone else) also plays a part in virality, and a metric you want to keep as short as possible.
Think about virality this way: CAC is the primary metric of how much it costs to acquire a new customer, and virality (specifically the K factor) predicts how much additional spread you’ll get from your users, without any additional spend. If your virality trends up, you know that at the same level of cost you’ll be getting a much larger install base.
These three acquisition metrics are key ones to track for every mobile app company looking to use analytics to get more bang for the buck. Stay tuned for part 3 in our metric series where we will tackle the all important Revenue Metrics.
For more insights into the mobile app industry, follow our Twitter,Facebook, LinkedIn or RSS feeds.

So, if you don’t know where to get started with a blueprint for your app, Rocket Farm Studios can take the pressure off.

Mobile App Metrics Part 1: 5 Usage Metrics

March 20, 2015
 
Ashley Rondeau
This is part 1 of a 3-part series on mobile app metric best practices. Part 1 is Usage Metrics. Look for part 2, Acquisition Metrics, and part 3, Revenue Metrics, in our next blog posts.In this era of big data, app developers can track just about any metric they want. But which metrics matter the most when it comes to telling you whether your app is on track to become the next big hit, or on its way to being buried under the other million apps in the App Store? In the first part of our series on mobile app metrics, we’ll examine usage metrics.Usage metrics are the foundation of performing analytics on your app’s relationship with your customer base, as well as laying the groundwork for acquisition and revenue metrics. There are plenty of data points to collect and various ways to slice and dice, but keeping it simple is key for these numbers. Let’s examine the five usage metrics that are most important to your business.

1. Downloads by Country

If you’ve ever wondered why Transformers movies keep getting made even with a Rotten Tomato rating of 18%, check out these stats from BoxOfficeMojo for the last movie:
Transformers  Age of Extinction  2014    Box Office MojoIt’s not really the US market that bolsters this franchise, it’s the international market that made up the bulk of the revenue. Though the movies aren’t loved by US critics or audiences, the executives know they can still make a killing overseas.
Likewise, pay attention to the countries where you’re seeing the most downloads. Knowing your game is big in Japan can help you pivot strategy quickly in order to maximize revenue. Do you need to translate the game? Can you buy ad space on other games popular in Japan? Conversely, seeing lagging downloads in major countries can tell you that your current marketing strategy isn’t working.

2. Daily & Monthly Average Users

The DAU and MAU metrics are similar but give you very different insights. The DAU is a leading indicator of churn rate. A low DAU means that your app is not immediately making an impact in your user’s usage pattern and is ultimately forgettable. You want to aim for a DAU of 10% of downloads as a general rule of thumb; this is a healthy number that shows that your app is useful to a significant portion of your user base.
MAU speaks to long term stickiness, which leads directly to user retention. Depending on your app vertical, you’ll want to make sure your MAU is in line with the average, about 30% of downloads, if not better. Don’t forget that you should be counting uniqueusers for this metric and that they’re only counted when they take an action other than simply opening up the app.
Many analytics sites will say the DAU/MAU ratio is the statistic to pay attention to (and to aim for 33%), but again it all depends on your app category. For example, a magazine app that releases once a month will skew this stat.

3. Retention Over 1, 7, 30 Days

While retention numbers vary wildly between app categories (ie dating apps vs weather apps), in general only about 14% of users stuck around after the first day of downloading an app. After 7 days, retention drops to 10%, then 2.3% after 30 days. While these numbers seem abysmal, remember that the barrier of entry for users is very low — it’s just a click for them — but app downloads are a numbers game, and increasing this statistic by even one percent is meaningful. A submetric for retention, frequency of use, can be tracked on a day-to-day basic to determine engagement as a leading indicator of retention. Again, keep in mind the difference between app categories.
Side note, surprisingly Android has a better retention rate than Apple:
platform-chart
Source: Localytics

4. Session Intervals

Knowing how often your app is used is akin to whether your app is actually successful or not. A good way to measure frequency of use is to measure session intervals (the time between user activity) for the simple reason that some apps are never relaunched. Choose a minimum time between sessions, say 30 minutes of inactivity, so any new activity after 30 minutes counts as a new session.
The more frequently your app is used, the more likely your retention numbers will go up. Keep a close eye on your frequency of use metric in context of what is appropriate for the category of your app. For example, a social networking app should be used at least once a day, while a medical app may only be used once every few weeks. Statista has a good chart of how frequently apps in various categories are used each month.

5. Session Length

Session length is the other side of the coin to session interval: you want to know how long users actually spend using your app as much as you want to know how long it takes for them to come back. Measure session length (from app open to a set period of inactivity) meticulously for insights into how effective your app is in retaining your user’s attention.
For example, if your average session length for your game is 2 minutes, but it takes 3 minutes to complete a round, you know you have a big problem keeping the user engaged.
• Average mobile app category session length 2014   Statistic
Source: Statista
There you have it, 5 usage metrics to track so you’ll have hard data on how much (or little) users are enjoying their experience with your app. To get these metrics, you’ll need to carefully instrument your app with an analytics package that isolates interactions down to the page view, especially since on that level you’ll get a wealth of information about how the app is actually being used (ie. where engagement really takes place). Start tracking these 5 key metrics from the initial release of your app for the best results.
Stay tuned for our part 2 of our metric series: tracking customer acquisition costs.
For more insights into the mobile app industry, follow our Twitter,Facebook, LinkedIn or RSS feeds.

So, if you don’t know where to get started with a blueprint for your app, Rocket Farm Studios can take the pressure off.

Mobile Tea Meet Up: 3/19 @ 6pm

March 18, 2015
 
Ashley Rondeau


Dan will be presenting at Mobile Tea tomorrow on the 3 Principles of Modern App Design. If you’re looking for a synopsis of how to fundamentally think through design when creating your app, please join us for the talk (and for the food and drinks!)
Mobile Tea
March 19th @ 6pm
McGraw-Hill Education Labs
281 Summer Street, Boston MA
See you there!

So, if you don’t know where to get started with a blueprint for your app, Rocket Farm Studios can take the pressure off.

Yes, Apple Watch is a Luxury Item. For Now.

March 10, 2015
 
Ashley Rondeau

apple costs less button
Raise your hand if you’re old enough to remember the Apple that used to tout this motto in the picture above. Been a long time since then, hasn’t it? Well, companies change. After all, Coke used to have actual cocaine in it. Over the years, Apple has gone from the people’s computer to somewhat of a luxury brand.
The advent of the new Apple Watch seemingly solidified Apple’s place in people’s eyes (and their wrist) as a company catering to the 1 percent. Starting at an already hefty $349, the watch must be paired with an iPhone 5 and up, running the latest iOS 8. While technically you could get a “free” iPhone 5c by locking yourself into a carrier contact that subsidizes the phone, the reality is that Apple Watch users will be paying for two expensive pieces of hardware for one to fully function.
So. Are they nuts?

It’s the same Apple story. Nothing to see here.

Despite all the fun memes that are already popping up poking fun at the supposed absurdity of wearing gear destined for obsolescence in a few years, the Apple Watch isn’t anything different from the debut of the iPhone. The first review on Engadget worried about the “steep price of admission” and signing a 2-year contract with AT&T. Gizmodo suggested everyone wait to buy until an updated version comes out. Don’t forget, the first iPhones were $499 and $599 upon release before a big price cut shortly thereafter. And those were 2007 dollars.
But the original iPhone sold like gangbusters because it was an incredible device and early adopters (the number of which surprised everyone) gave such great word-of-mouth reviews. It was a luxury item, but there was a market for it, and Apple learned that people were willing to not only shell out the bucks to be the first ones holding their gear, but take pride in being pioneers in a new wave of technology. Call it the “Cult of Apple,” but it’s just brand loyalty at its finest.
apple watch
With the Apple Watch, Apple is just running with a formula that has worked for them with the iPod, iPhone, and iPad. Namely, release a good product as a luxury item, then iterate and scale back costs to eventually make it affordable to everyone. Would anyone consider an iPod or iPhone luxury items anymore? Not really, since you can get a Shuffle for $49 and an iPhone for free. Only the iPad may still be considered a luxury item, but an iPad mini is a decent bargain at $249 with all it can do as a personal computer.
So jump three years from now and we’ll be looking back and scoffing about the Apple Watch’s high initial price while $99 models are rolled out. It’s inevitable if you look at Apple’s history.

Changing customer behavior, once again.

The real question is whether Apple can, yet again, convince people to change their consumption behavior. Before the iPhone, cell phones were less disposable. Remember, the best selling cell phone before the iPhone was the Motorola RAZR, which was the top model for five years without any radical redesigns. While the actual lifecycle of a RAZR and an iPhone may be comparable, iOS upgrades and new models started coming every 6-9 months which eventually changed consumer behavior from holding onto a phone for a number of years, to upgrading hardware almost annually. Apple changed how people buy cell phones.
Today, it’s odd to think about replacing a wristwatch every few years. Even on the low end, watches last a decade and often it’s just the battery that needs replacing. Can Apple change customer behavior again, convincing people to upgrade technology that we’re not accustomed to upgrading?
It remains to be seen, and it’s the most important question to ask in the conversation of whether Apple Watches can sustain itself as anything other than a niche luxury item. Even if prices come down to $99 a pop, will people be willing to upgrade every couple years? Apple is betting that they will. Fortunately for them, they’ve been right about this many times already.
For more insights into the mobile app industry, follow our Twitter,Facebook, LinkedIn or RSS feeds.

So, if you don’t know where to get started with a blueprint for your app, Rocket Farm Studios can take the pressure off.

Follow the Paper Trail: Monetizing Apps in Unexpected Ways

March 3, 2015
 
Ashley Rondeau

Paper by FiftyThree
Source: fiftythree.com
Paper, a drawing/sketching/painting app by FiftyThree, caused a small commotion in February by making all of their tool upgrades free. Previously, artists would have to shell out a few extra bucks for tools such as Sketch, Outline, and Mixer (for color) and many fans of Paper were happy to receive a load of great features for no charge.
What’s interesting is the reason FiftyThree’s CEO, Georg Petschnigg gave for this move, saying “Pencil has been doing phenomenally well.” Pencil is the company’s beautiful, Bluetooth stylus that works with the Paper app and with other apps as well. It is the only stylus sold in Apple stores and the top selling stylus on Amazon.com. In essence, FiftyThree is selling so many of their high end stylus, they can afford to give away their full-featured app for free, to attract new customers.
Keep in mind, Pencil was launched well over a year after Paper. It’s unlikely anyone over at FiftyThree predicted how popular their stylus would be, to the point where it is the major revenue source for the company over their flagship app that took the App Store by storm. While they won’t reveal any numbers, Petschnigg gave this great quote that more app developers should not only keep in mind, but strive to emulate:

“For us the mission is still clear. We want to make creativity and productivity more accessible. That will never change. Now our business model, that can evolve.”

What a great and simple statement. Petschnigg reaffirms his company’s commitment to their original vision and purpose with their app, but acknowledges that hey, when it comes to making money, whatever works.

This recalls when Rovio’s Angry Birds was the hottest thing on everyone’s smartphone. While the $.99 game was a big payday due to the popularity of the game, in 2012 the physical goods Rovio sold with the Angry Birds brand brought in an estimated 50% of their revenue. They smartly realized that there was a goldmine of merchandising opportunities with birds and pigs and soon the basic game was free to download to attract more fans who would recognize their brand.

As you get ready to design and launch your app, keep FiftyThree in mind and not only be open to new streams of revenue aside from the usual methods of ads, in-app purchases, and affiliate installs; but actively search for them. Your cute logo or mascot could become popular IRL (thus, always a good idea to invest in the look of your app — you never know what the public might fall in love with) or you could take over an entire accessory market like FiftyThree did. Think outside the app.

For more insights into the mobile app industry, follow our Twitter,Facebook, LinkedIn or RSS feeds.

So, if you don’t know where to get started with a blueprint for your app, Rocket Farm Studios can take the pressure off.